How Bullish Are US Soybeans?

The noncommercial side of the soybean futures market has been triggered into buying this week, first by social media posts from the US president then from some “interesting” numbers from USDA.
The market's real fundamental reads have actually grown more bearish, meaning national average basis and futures spreads.
The jury is still out on the technical side of the market, for what that's worth.
As you likely know, Tuesday’s session included the latest round of monthly supply and demand guesses from USDA, this one including the hullabaloo of number billed as “first survey based”, but does that improve the reliability of the numbers? Particularly these days when the Secretary of Agriculture’s only mission is to make the US president’s social media posts sound less – what word am I looking for here…Well, you can fill in the blank yourself. What if Tuesday’s WASDE numbers for soybeans were created in such a way to trigger algorithms into buying? What if the reads on real market fundamentals were telling a completely different story? These possibilities add intrigue to the question of how bullish US soybeans are as we make our way through the Dog Days of Summer (August).
Since I opened this piece by mentioning the August WASDE nonsense, let’s take a look at some of the numbers for soybeans:
- Old-crop ending stocks decreased by 20 mb (I don’t believe this at all)
- Exports were increased by 10 mb to 1.875 bb
- The latest export shipment pace projection came in at 1.85 bb
- Crush demand was increased by 10 mb to 2.42 bb
- The latest monthly Oilseed report showed the US on pace to crush 2.43 bb as of the end of June
- New-crop ending stocks were decreased by another 20 mb
- Total supplies decreased by 63 mb
- Beginning stocks decreased by 20 mb
- Production was decreased by 43 mb
- Fewer acres, both planted and harvested
- higher yield
- Demand was decreased by 43 mb
- Exports were lowered by 40 mb
- Crush left unchanged at 2.54 bb
- New-crop global ending stocks were decreased by 1.17 mmt
- due to a like decrease of 1.29 mmt in production
- US down 1.16 mmt
- Exports were increased by 10 mb to 1.875 bb
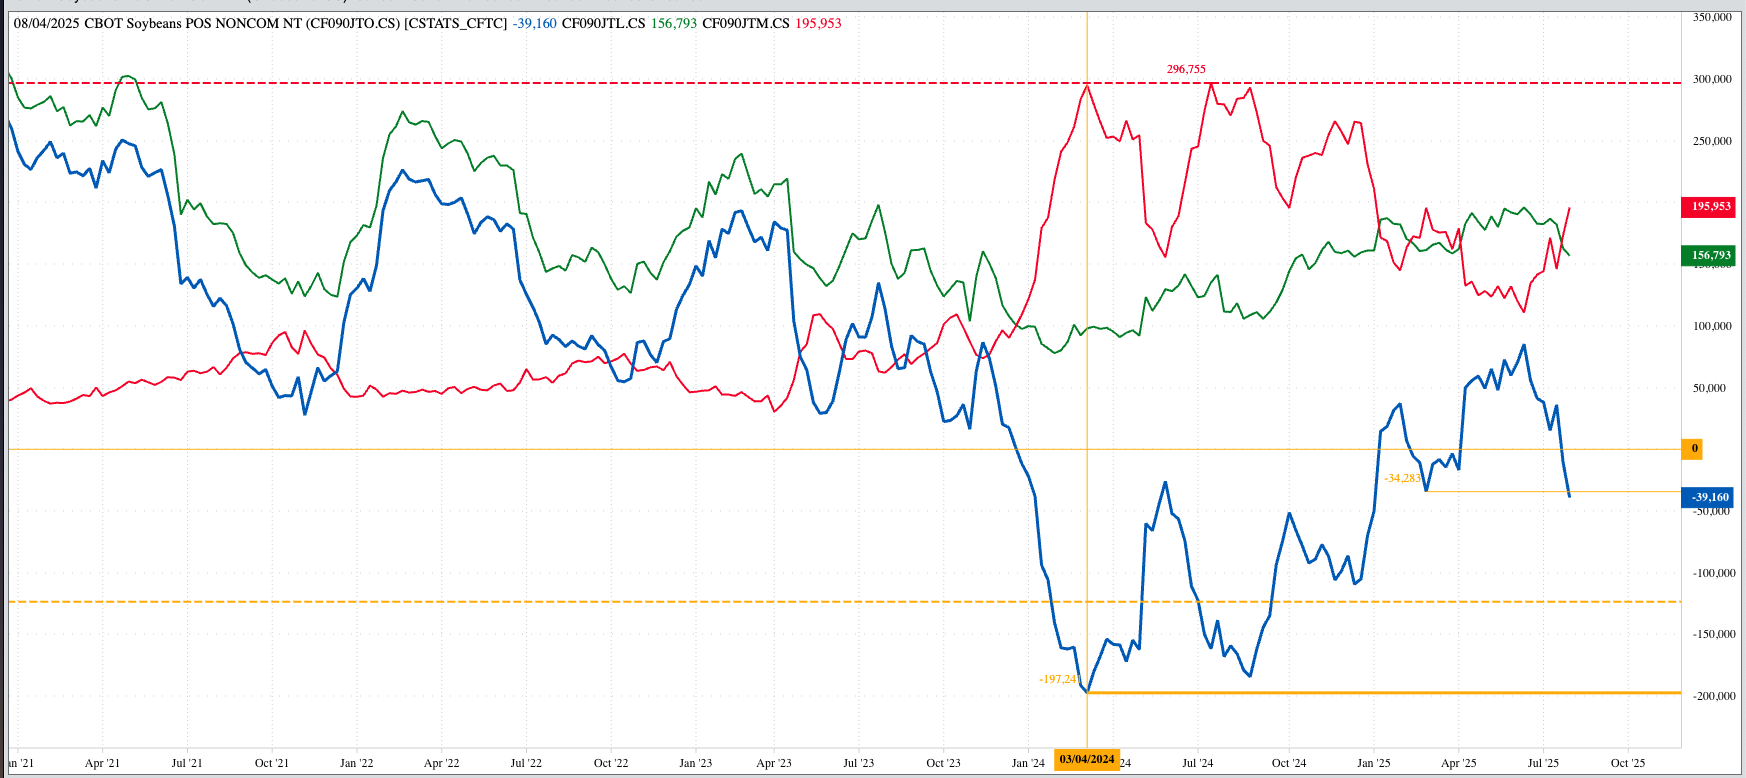
Tuesday, before the release of USDA’s imaginary August numbers, the November soybean contract lost as much as 17.25 cents. After the guesses were released, November gained as much as 23.75 cents before closing 21.5 cents higher on CME reported trade volume of 326,000 contracts. (It’s days like Tuesday that highlight why I favor the corn market.) Again according to the CME, the soybean market as a whole showed 615,220 contracts changing hands. As for open interest, the soybean market decreased by 2,350 contracts with November losing 4,040 contracts on its own. In my mind, this confirms what I talked about in Tuesday’s Afternoon Commentary, that the rally was driven by noncommercial short covering, putting the spotlight on Friday’s CFTC Commitments of Traders report. For the record, November closed 42.0 cents higher from Tuesday-to-Tuesday after the latest Commitments of Traders report (legacy, futures only) showed Watson held a net-short futures position of 39,160 contracts.
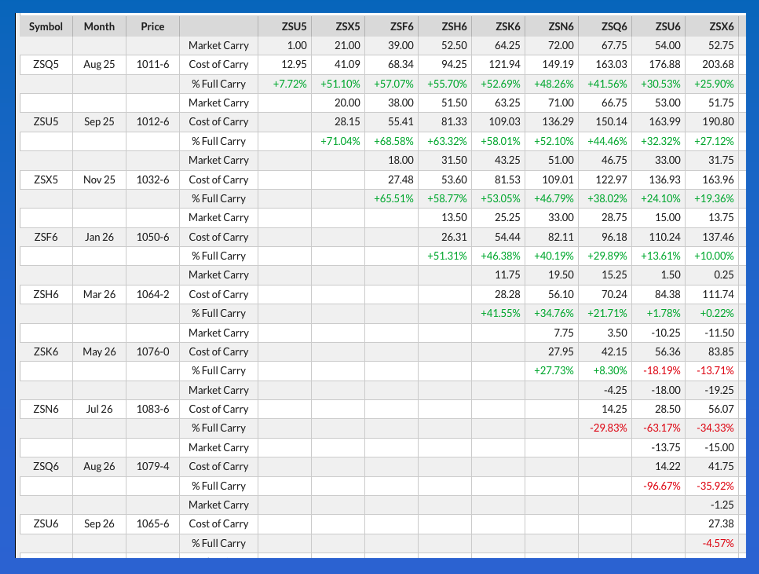
I can only imagine how the BRACE Industry[i] howled about the lower production guess from USDA. Do I agree with this round of estimates? Let me put it this way: From the end of June through the end of July the percent of calculated full commercial carry covered by the Nov-Jan spread increased from 55% to 65% while the Jan-March increased from 46% to 59%. Enough said.
Fast forward to Wednesday morning and the soybean market was higher again. The November issue (ZSX25) rallied as much as 9.75 cents on trade volume of 40,000 contracts and was sitting 9.0 cents higher as of this writing. Fundamentally, the National Soybean Index ($CNSI) came in at $9.7250 Tuesday evening putting national average basis at 60.25 cents under November futures as compared to last Friday’s final figure of 58.25 cents under November. This tells us the commercial side did not see the need in following the futures market higher, at least not to the same degree.
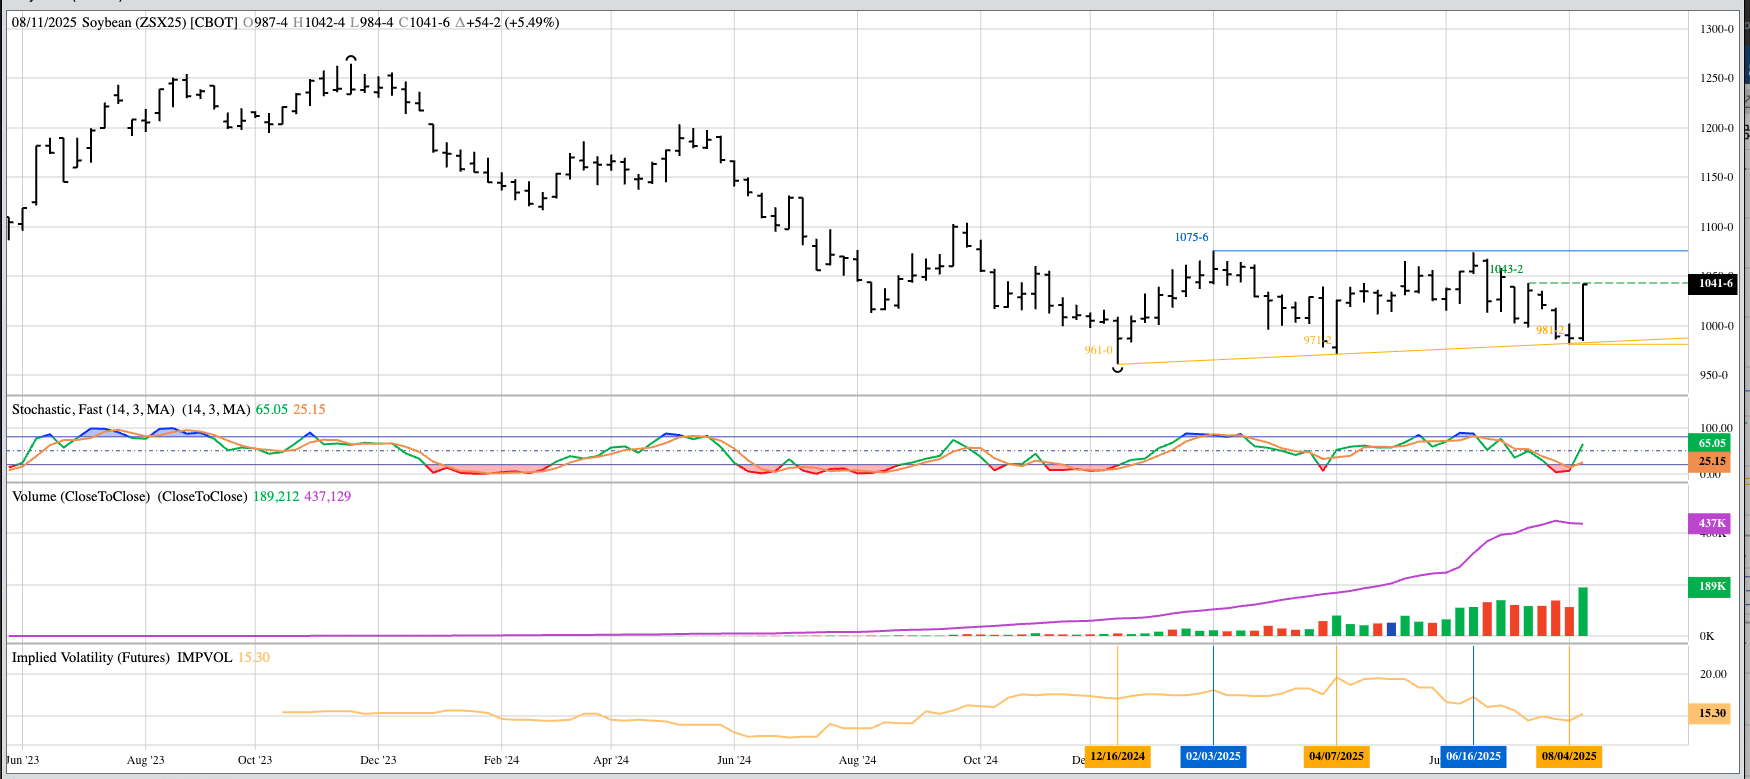
From a technical analysis point of view, the Nov25 soybean futures contract remains in a secondary (intermediate-term) sideways trend on its weekly chart.
Here we see a relatively flat top between the highs of $10.7575 from the week of February 3 and $10.7425 from the week of June 16. On the low end we see an ascending trend line connecting the lows of $9.61 from the week of December 16, 2024, and $9.7125 from the week of April 7. Last week’s low of $9.8125 was a test of the extended trend line.
Digging back through the textbook I have for Technical Analysis[ii], this pattern is called an Ascending Triangle and can occur at the bottom of a downtrend. The key will be a break of the upper line connecting the highs.
A couple things to remember:
- I’m not a big user of trend line analysis
- Watson doesn’t pay attention to classic technical patterns
- Once again raising the question of if classic technical analysis matters anymore
We could also look at the November contract from a momentum point of view. Wednesday morning’s high of $10.4250 was within sight of the previous 4-week high of $10.4325. Referring to the previous mentioned textbook (pg. 268):
- The system based on the four-week rule is simplicity itself:
- Cover short positions and buy long whenever the price exceeds the highs of the four preceding full calendar weeks.
- Liquidate long positions and sell short whenever the price falls below the lows of the four preceding full calendar weeks.
As mentioned earlier, the soybean market has seen Watson cover short positions this week. If the November issue takes out its previous 4-week high, will funds go long the market with reads on real fundamentals still showing a more bearish long-term outlook?
The coming weeks and months will be interesting.
[i] BRACE Industry = Brokers/Reporters/Analysts/Commentators/Economists who never saw a set of government numbers they didn’t like or feel the need to tell everyone how important it is.
[ii] Technical Analysis of the Futures Market by John J. Murphy, 1986 edition
On the date of publication, Darin Newsom did not have (either directly or indirectly) positions in any of the securities mentioned in this article. All information and data in this article is solely for informational purposes. For more information please view the Barchart Disclosure Policy here.